The second DAPSI Open Call was open between the 20th of November 2020 and the 21st of January 2021. A total of 176 applications were submitted representing 66% of the number of applications started.
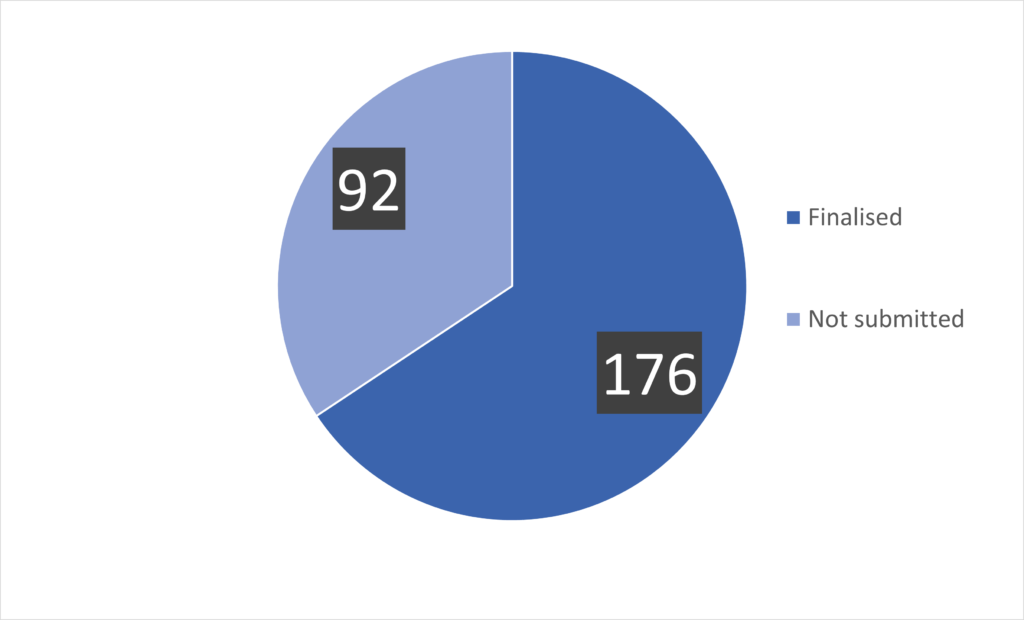
NUMBER OF APPLICATIONS FINALISED OR NOT SUBMITTED
Profile of applicants
Applicants were asked whether they were applying as a group of individual(s) and organization(s), as a team, as a consortium, as a natural person or as a legal entity. Out of the 176 proposals, 70% (123 applications) were submitted by single legal entities, 19% (33 applications) by a groups of organizations (consortia), 5% (8 applications) by groups of individual(s) and organization(s), 3% (6 applications) by groups of individuals (teams) , and another 3% (6 applications) by single individuals (natural persons).
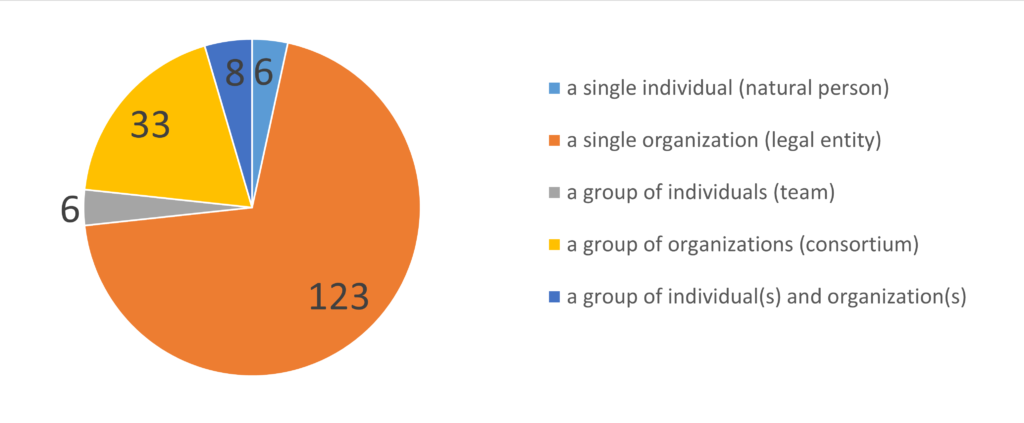
PROFILE OF APPLICANTS
Countries
The second Open Call received proposals from 39 different countries. With a predominance of German (39), French (30), British (21), Romanian (16) and Italian (15) applications, followed by applications from Spain, Netherlands, Portugal, Finland, Greece, Estonia or Switzerland among others. A large number of countries were covered thanks to the communication and dissemination efforts in getting participants from all eligible countries.
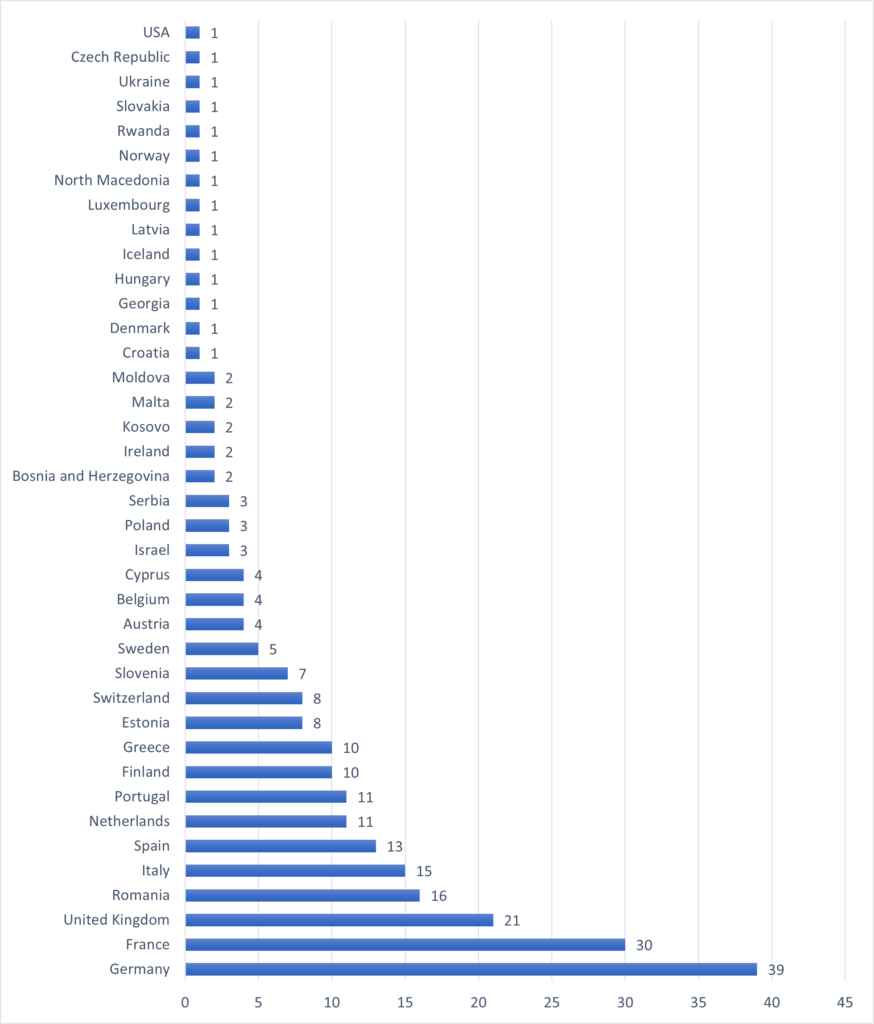
NUMBER OF APPLICANTS PER COUNTRY
DAPSI challenges selected
In this second Open Call, DAPSI allowed for applications within 3 established challenges or any other challenge within the data portability landscape. Applicants were able to select between Data Compatibility & Interoperability, Service Portability, Security & Privacy or Other.
The distribution of applications received among the different challenges can be seen in the figure below, which shows Data Compatibility & Interoperability as the challenge chosen by the majority of applicants (69%), followed by Security & Privacy (57%), Service Portability (55%) and finally Other (10%). Note, the applicants could select multiple challenges.
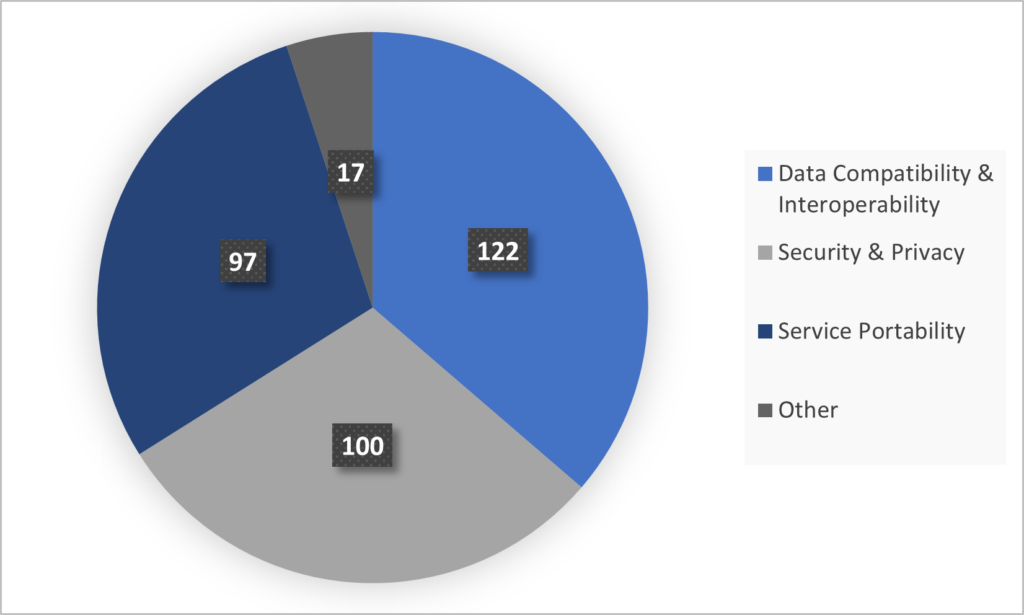
APPLICATIONS PER CHALLENGE
Submission evolution
The chart below shows the evolution of applications started and submitted along time, in which 56% of the submissions were made on the last submission day. And 86% of the submissions were made the 3 days preceding the closing date.
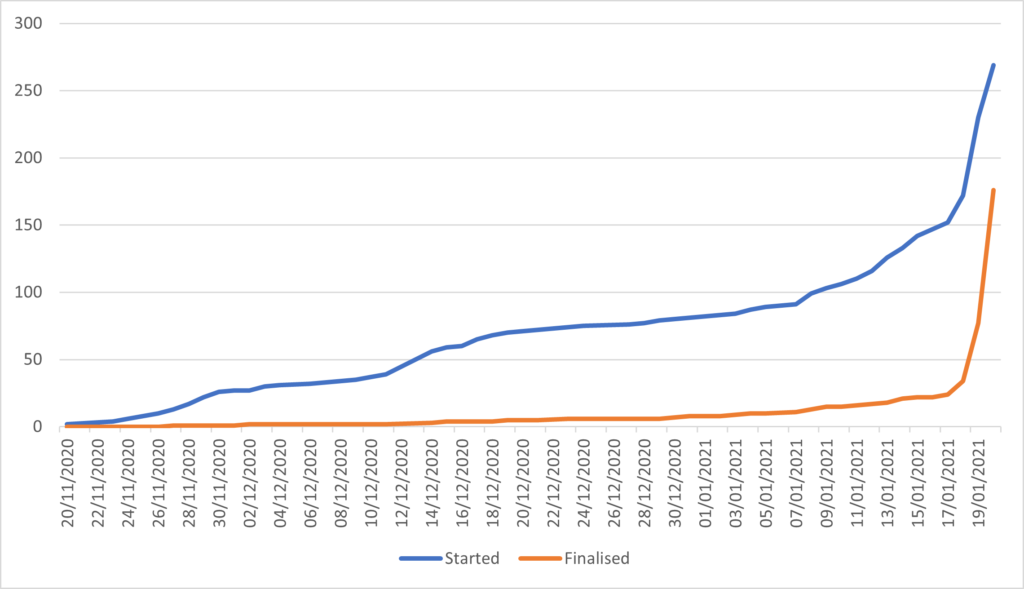
NUMBER OF APPLICATIONS STARTED AND FINALISED BY DATE
Proposals selected
After the evaluation process, 15 proposals have been selected from the 176 submitted (8,5%).
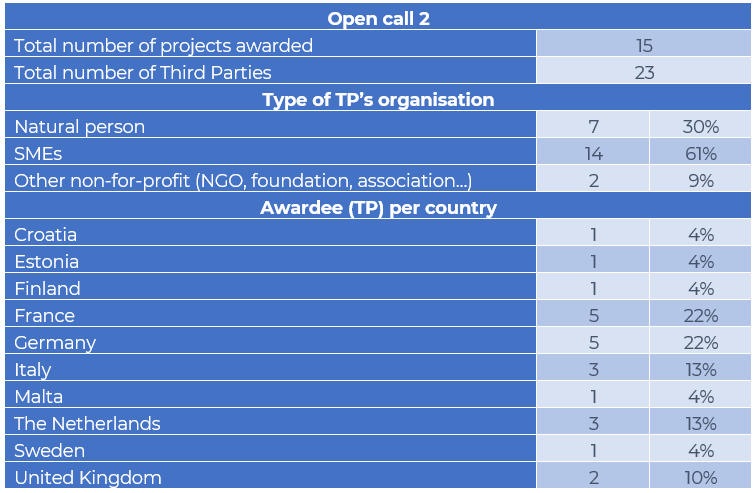
Budget allocation per country
Regarding the funding that the programme is going to provide to the selected third parties, is worth mentioning the balanced distribution among some countries. The main figures from the call are represented in the following figure:
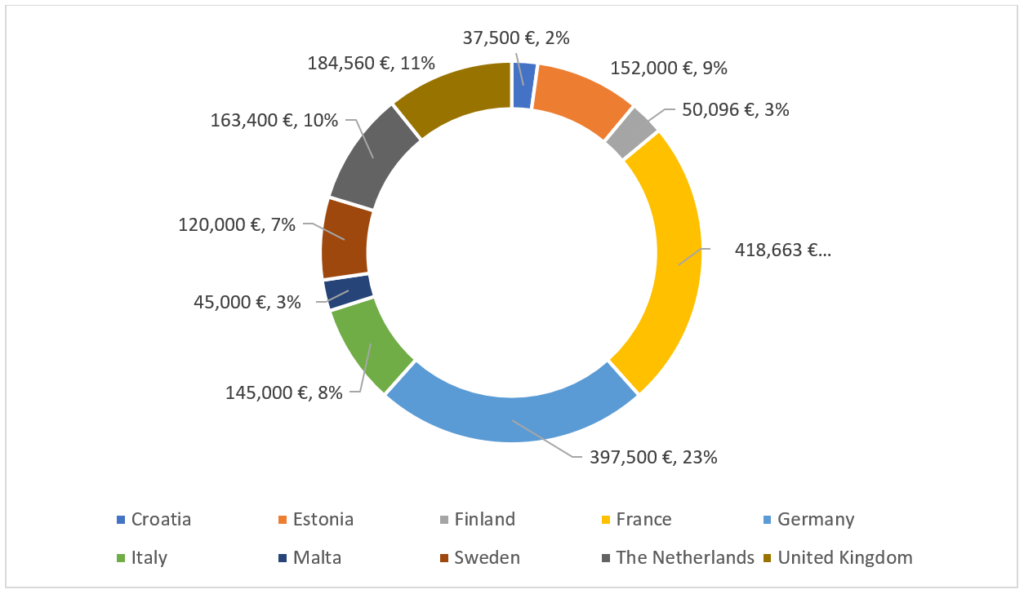
BUDGET ALLOCATION PER COUNTRY

